Our customer experience vision
To have a continuous focus on understanding, improving, and evolving our community’s experience with council.
Our commitment to our customers
We aim to provide exemplary customer service that is seamless, authentic, and consistent across the organisation.
We are committed to:
 | Being caring and empathetic when speaking to you. |
| Understanding your needs. |
| Helping you to quickly find the right information or person to talk to the first time. |
| Being open and setting honest expectations. |
| Keeping you up to date. |
| Taking ownership of your enquiry and ensuring it is resolved. |
| Being curious and willing to learn so we can unlock opportunities and better ways to help you. |
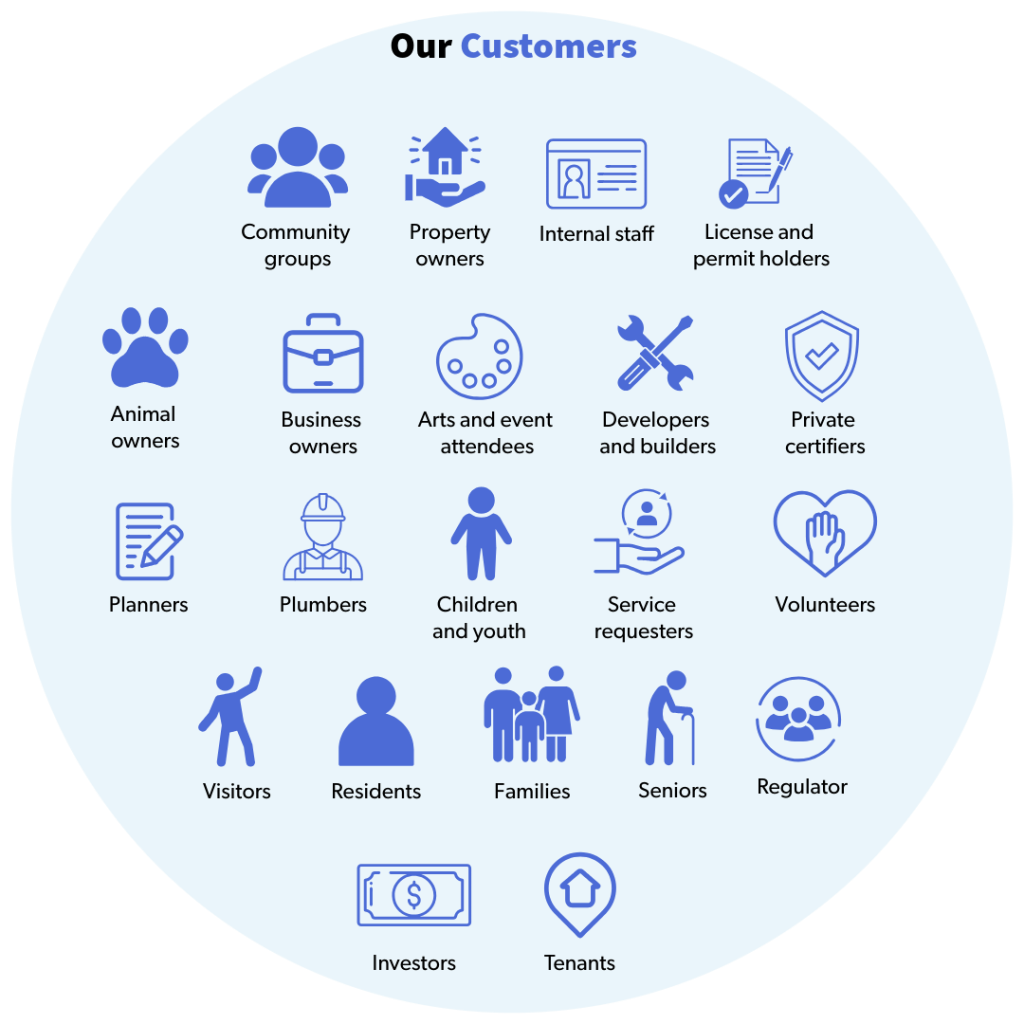
Who are our customers?

61,531
Population
(ABS Census 2021)

41
Median age
(ABS Census 2011)

17,067
Families
(ABS Census 2021)

25,855
Private dwellings
(ABS Census 2011)

3,687
Businesses
(ABS Census 2021)
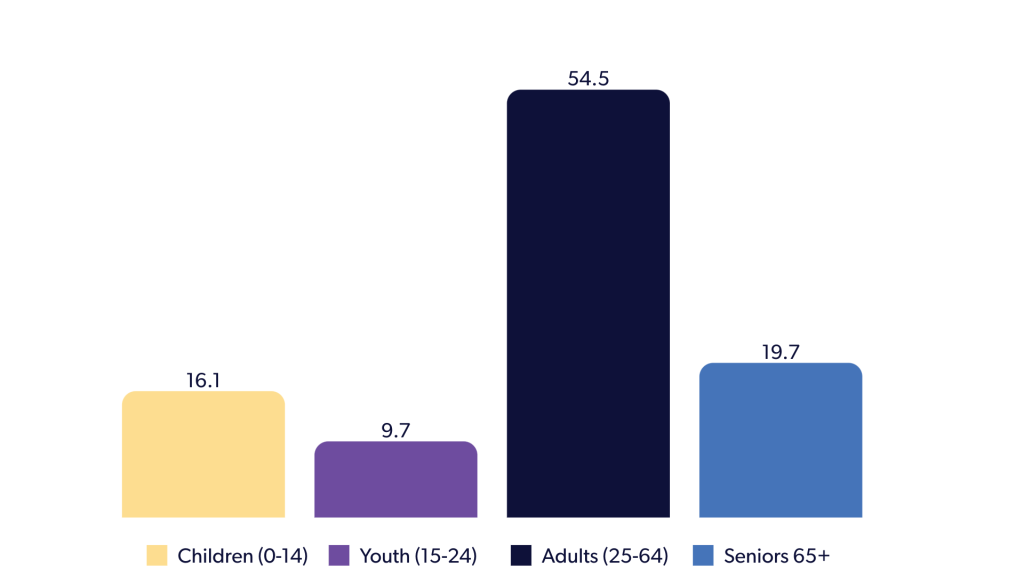
Customer age profile (ABS Census 2021)
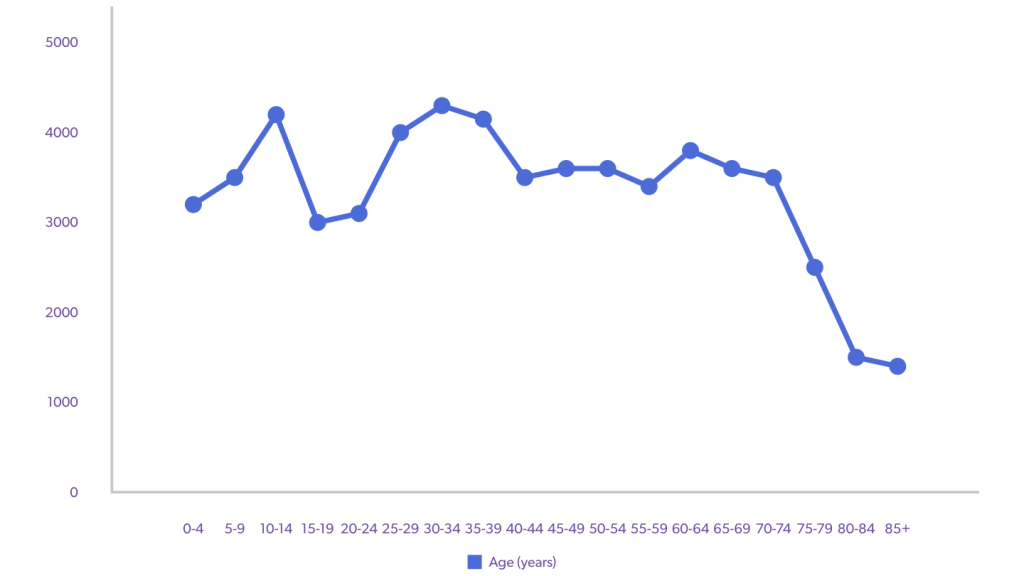
Age breakdown
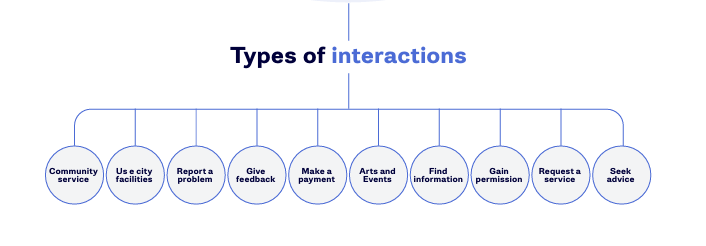
Why do customers contact council?
Customer data snapshot over 12 months

More than
48,000
calls received

646,000
page views on the website

785
development applications lodged

60%
of users viewed council’ website from a mobile phone

725
building permits

450
young people participated in youth programs

31,538
visits to Your Say Clarence website

10,105
Pets were
registered

470
plumbing
permits

3,603
contributions to council’s consultations

2,151
vaccines administered
by council (2023)

35,881
social media engagements

48
food
inspections

727
families access our childcare services

19,190
attended an arts
festival or event

1,544
preliminary planning
assessments
(including requests)

88,036
Rates notices
sent out
Findings
What have we learnt about our customers?
Through our research we discovered:
The top five ways our residents currently interact with council:
- Website – 36%
- Phone – 33%
- In person – 29%
- Email – 27%
- Post/letter – 20%
Top five ways residents would like to interact with council in the future:
- Email – 51%
- Website – 44%
- Phone – 44%
- In Person – 43%
- Social Media – 30%
Digital expectations are increasing with the top two future preferences being email and website.
Preferred future channels by age groups
| Preferred channels | Total | 39 years old or less | 40-59 years old | 60+ |
|---|---|---|---|---|
| 51% | 36% | 62% | 57% | |
| Website | 44% | 335% | 54% | 46% |
| Phone | 44% | 31% | 44% | 56% |
| In person | 43% | 22% | 47% | 60% |
| Social Media | 30% | 39% | 35% | 18% |
Council app, online chat, and SMS were least favoured as future channels for interaction with council. Sixty per cent of residents prefer to contact our Customer Contact team within business hours. There was limited support for outside hours contact. Clarence residents are not averse to trying new products or trends.
They were most likely to describe themselves as ‘generally in the middle when it comes to trying new things’ (52%), followed by ‘generally among the first’ (29%).
Engagement:
- 81% of Clarence residents are confident with digital technology
- Future Engagement preferences for sharing opinions include:
- Survey – 70%
- Email/letter (submissions) – 61%
- Phone – 36%
- Foyer displays – 31%